DP0.1 Data Products
The DESC DC2 Data Set
DP0 is based on the the simulated, Legacy Survey of Space and Time (LSST)-like images generated by the Dark Energy Science Collaboration (DESC) for their Data Challenge 2 (DC2; arXiv:2010.05926). DP0 only uses the 300 deg2 of DC2 images that were simulated for five years of the LSST’s wide-fast-deep component (WFD; also called the main survey) with a baseline cadence (i.e., a fiducial observing strategy). For more information about the LSST regions and cadence see Ivezic et al. (2019).
Simulated Objects and Images: The DC2’s WFD simulated images include galaxies (with large-scale structure), Type Ia supernovae, and stars (10% of which are variable). DP0.1 does not include AGN, strong lenses, solar system objects, non-Ia extragalactic transients, or diffuse features (e.g., tidal streams, intracluster light). The DESC simulated the DC2 images using the imSim package.
Image Processing: The DESC processed the simulated DC2 images with Version 19 of the LSST Science Pipelines. DP0.1 makes the DESC’s DC2 images and catalogs available to RSP users. For DP0.2, the Rubin Data Production team will reprocess the same images with the most up-to-date version of the LSST Science Pipelines, and release the resulting images and catalogs in mid-2022.
DP0.1 Data Products Definition Document (DPDD)
Disclaimer: The DC2 data set is being made available for use on a shared-risk basis. The LSST Science Pipelines which produced these images and catalogs is in active development. The data contents, formats, and related documentation are all incomplete.
Future data previews and Operations-era data releases will produce images and catalogs that more closely resemble the plan laid out in the Data Products Definitions Document (DPDD; ls.st/dpdd). It is important to note that many of the future data products listed in the DPDD, and in particular all of the Prompt Products such as difference images and alerts, are not available for DP0.
Images
For DP0.1 the DC2 data set has only two types of images: coadds and processed visit images. For DP0.1, images are only accessible with the Butler via the Notebook Aspect.
Processed Visit Images (PVIs):
A fully-qualified LSST image from a single visit (in other words, a single pointing) that includes the science pixel array, a quality mask, and a variance array,
in addition to a PSF characterization and metadata (including calibration metadata) about the image.
PVIs are stored with the background already subtracted.
A single CCD of a PVI is called a calexp.
For more information about how PVIs are created, see Single-image processing.
There are many associated data products that are accessible alongside PVIs. These include the background (calexpBackground) that was subtracted from the calexp, which can be retrieved separately.
Each PVI also has an associated mask plane that encodes quality and other information about each pixel, a WCS solution to be used in converting between pixel and sky coordinates,
a photometric calibration object to be used in converting between fluxes and magnitudes for astronomical sources, and a model of the point-spread function (PSF) at each position on the image.
Coadd Images:
An image that is the combination of multiple input images, often referred to as just a coadd or a deep coadd.
The input images have been aligned to a common projection and pixel grid; corrected to the same photometric scale, zero-point, and point-spread function (PSF);
and had bad pixels, artifacts, and transient and variable object flux removed prior to combination.
Coadds are stored with the non-astrophysical background already subtracted.
For more information about how PVIs are created, see Coadded-image processing.
As with PVIs, the coadds also have associated data products including the background model that has been subtracted, the mask and variance planes associated with the image, a WCS solution, photometric calibration, and a PSF model.
Coadd images are divided into tracts (a spherical convex polygon) and tracts are divided into patches (a quadrilateral sub-region, with a size in pixels chosen to fit easily into memory on desktop computers, about the same size as a calexp).
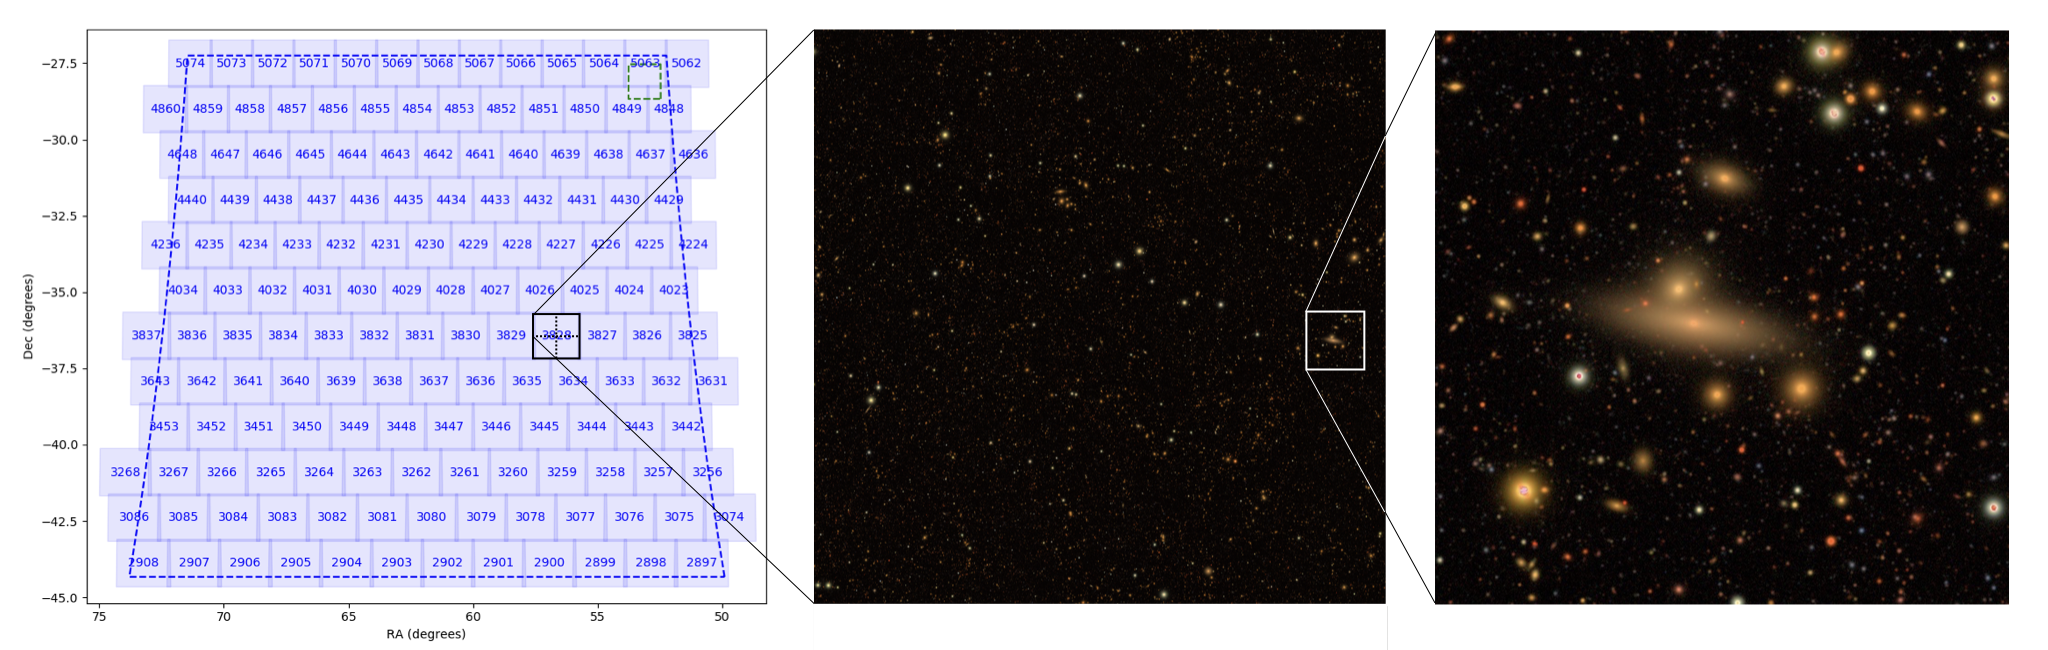
Figure 15 from The LSST DESC DC2 Simulated Sky Survey, showing the simulated WFD region divided into tracts. The center image is one tract quadrant, and the right image one hundredth the area of the tract quadrant. Patches are larger than the right image, as described in the DESC’s paper: “each tract is composed of 7 × 7 patches, and each patch is 4,100 × 4,100 pixels with a pixel scale of 0.2 arcsec”.
The first of the Jupyter notebook tutorials demonstrates how to identify the tract and patch for a given coordinate, and retrieve and plot a coadd image. The image display and manipulation tutorial demonstrates how to retrieve and display a coadd image, and to use its WCS and methods associated with the image to extract a cutout image zoomed in on a region of interest.
Catalogs
Source detection, measurement, and characterization have been run on both the PVIs and coadds to generate catalog data for DP0.1 (see also Coadded catalog production). Catalog data are accessible with the The Table Access Protocol (TAP) service via the Portal or Notebook Aspect, and with the Butler via the Notebook Aspect. Although this will not be the case for the Operations-era data releases, for DP0.1 the TAP and Butler table data are not named or organized the same way. Here we distinguish between the TAP- and Butler-accessible catalog data products. The recommended catalog interface for DP0.1 is the TAP service.
Schema: A table’s “schema” refers to the column names, units, and descriptions of the tabulated data. Links to full or curated versions of the table schema (curated meaning limited to columns that will be of most use to most DP0 delegates) are provided in the tables below. A DP0.1 schema browser is also available, thanks to the Rubin Data Management team.
Principal Columns: For convenience, Rubin Observatory staff have identified the principal columns which are most likely to be useful. These principal columns will be pre-selected in the Table View of the RSP’s Portal Aspect. The table schema below also identify the principal columns.
Recommended Search Parameter “detect_isPrimary = True”:
A good default search query parameter for catalogs of objects in the coadded images is to set detect_isPrimary = True, i.e., for the dp01_dc2_catalogs.position (TAP) and deepCoadd_ref (Butler) catalogs.
The detect_isPrimary parameter is True if a source has no children, is in the inner region of a coadd patch, is in the inner region of a coadd tract, and is not “detected” in a pseudo-filter.
Setting detect_isPrimary to True will remove any duplicates, sky objects, etc.
TAP Catalogs: The five TAP-accessible catalogs in the table below are generated from coadded images and are available via both the Portal and Notebook Aspects. For all Portal-accessible TAP catalogs, one way to view and interact with the schema is by using the Portal’s “table view” in the TAP service for single-table queries, as described in the Introduction to the RSP Portal Aspect. Schema for all five TAP-accessible catalogs can be also viewed and interacted with in a Jupyter Notebook by following the examples in Section 2.2 of the first of the Jupyter notebook tutorials. The table below contains links to pages that list the schema for these tables: the column names, units, data types, and a description.
Catalog Name |
Schema Link |
Description |
|---|---|---|
object |
See Appendix B1 of the DESC DC2 Release Note for full schema. Objects: Principal Columns. |
The object table from the DESC DC2 simulated sky survey as described in the DESC DC2 Release Note. Includes astrometric and photometric parameters for objects detected in coadded images. (137 columns) |
truth_match |
See Appendix B2 of the DESC DC2 Release Note for full schema. Truth Match: Principal Columns. |
The truth-match table for the DESC DC2’s object table as described in the DESC DC2 Release Note. Includes the noiseless astrometric and photometric parameters and the best matches to the object table. (30 columns) |
position |
Select astrometry-related parameters for objects detected in the coadded images, such as coordinates, footprints, patch/tract information, and deblending parameters. (29 columns) |
|
reference |
Measurements for objects detected in the coadded images, including photometry, astrometry, shape, deblending, model fits, and related background and flag parameters. This table joined with the position table is very similar to the object table, but with additional columns. (236 columns) |
|
forced_photometry |
Forced photometry measurements for objects detected in the coadded images, at the locations defined by the position table. (747 columns) |
Butler Catalogs: The recommended catalog interface for DP0.1 is the TAP service. However, because the catalog of sources detected in individual processed visit images (PVIs) is only available through the Butler, the Butler schema for several of the most useful DP0.1 catalogs are provided below. The Butler catalogs are listed in the approximate order that a processing workflow with the LSST Science Pipelines would generate them. For examples of how to access these Butler catalogs, see the Jupyter notebook tutorials about the Butler.
Table Name |
Schema Link |
Description |
|---|---|---|
src |
Source detections in a single processed visit image (PVI; also called a calexp). (234 columns) |
|
deepCoadd_ref |
Source detections in deep coadded images across all filters. (495 columns) |
|
deepCoadd_forced_src |
Forced photometry for sources in deep coadded images. (508 columns) |